The Estonian Rescue Board (ERB) registered a total of 1110 building fires in 2017 with direct damages of 7.2 million euros [1]. In 2018, a total of 50 people lost their lives in a fire and 102 were injured [2]. While the rate of fires per capita in Estonia is comparable to the Nordic countries, the rate of deadly fires is significantly higher [1]. As a part of the project “Machine learning and AI powered public service delivery”, we use machine learning methods to assess the risk scores and find significant features to help predict building fires in Estonia in order to prevent them.
The Data
To start predicting fires, we needed data about fires that had occurred in the past. This data is gathered by the Rescue Board and consists of the location and time of the fire, as well as some details about the buildings the fires have occurred in. The rescue board kindly shared this data with us. However, to make sure that the affected buildings were not identifiable, their exact locations were not disclosed, instead, we were given larger areas in which they resided.
To predict future fires, we needed our model to distinguish between buildings that were less likely to catch fire and those that were more likely to do so. To this end, we looked into the Estonian building registry [3]. Using the building data and the existing fire data, we could build a model that could predict which buildings would be more likely catch fire in the future. Though, it would tell us nothing about when the fires would happen. To address this problem, we added the weather observations made at the time of each fire to our database. This allowed us to use weather forecast data to predict which buildings have a higher risk of catching fire in the upcoming days.
Before we could start building our models, we needed to clean the building registry data. First, we filtered out the features that were not in our building fire database, because they could not be used for our task. Second, for the features that were in both databases, we needed to inspect whether they were properly and similarly filled. Otherwise, our model would have learned the differences in the databases instead of the underlying differences between the buildings that had caught fire and the buildings that had not. For instance, both databases had a column consisting of the years the buildings were built.After some inspection we noticed that this feature was not properly filled for buildings that were built before 1994, which is when the building registry was created. Therefore, we only looked at buildings that were built after 1993 in both databases.
After the data exploration phase, we settled on only a handful of features to use from the building registry. The building usage code differentiates types of buildings like factories, office spaces, detached and terraced houses, and apartment buildings. The status of the building tells us whether the building is still in use or not.
The weather data did not need much cleaning, because the methods for its collection have stayed the same over the past years. The weather data consisted of attributes like temperature, humidity, air pressure. We also calculated the hourly change among these features, to see if rapid weather changes can cause more fires.
The Task
Before we could start training our machine learning models, we needed to define the precise task to be addressed. In our case, we decided on the binary classification task, where the model had to look at the building and weather data, and decide if a data point was taken from the database with fires or without. The outcome of this task could help us assign risk scores to buildings once we get more precise data, it would allow us to predict the number of fires in different regions, it could tell us what are the important features in predicting fires, and it would give us an understanding whether predicting fires is possible and how well could it be done using machine learning.
Main Problems
Before choosing our machine learning algorithms, we had to address a few problems. First, our data was wildly imbalanced. We had around 8000 data points (building fires) in the building fire database. However, there were around 900 000 buildings in the building registry. This number got cut in half once we dismissed the buildings that were built before 1994, but the difference was still huge. To solve this problem, we needed to choose a machine learning method that could take into account the imbalance of data.
The second problem we faced was that in order to get the best results, our model needed to be able to use all of our data. However, the building data is static and unchanged, while the weather data changes every hour. So, for building fires, we had the exact building and weather data for a certain time, but there was no single fixed weather data instance to tie to a building that had not caught fire. If we had added the weather data of every hour from the year 2014, we would have further imbalanced the data and made the model extremely sensitive to weather, thereby making the building data obsolete.
We addressed this problem by adding the weather observation of a randomly selected hour to each building in the building registry. Since the number of instances in that registry is large, this should give a big enough sample of weather observations to find out if weather conditions are important in predicting fires.
Training Models and Weighted XGBoost
When choosing machine learning methods, our first thought was to use XGBoost [4], which is a learning algorithm that uses gradient boosted decision trees, can be used for both regression and classification problems, and has been shown to give state-of-the-art results in many machine learning and data mining challenges. While XGBoost works well even on imbalanced classification datasets, we decided to use a modified version of it, called weighted XGBoost [5]. This was due to the severity of the class imbalance in our datasets. Weighted XGBoost pays more attention to misclassification of the minority class, which, in our case, was the class of buildings that had caught fire. While the trained model could have given us more false positives (buildings that are not going to catch fire, but the model incorrectly places them with fires), as long as the false positive rate was not too high, it seemed acceptable.
Finally, before we could start training our models, we needed to split our data into training and test data. Training data is the data that the model sees and uses during training, and test data is needed to check how well the model does on data it has not seen before. We used the data of the fires that occurred before 2020 to train the model. This allowed us to test the trained model on the fires of 2020, thereby giving us the best possible indication on how well the model would do in the future.
The Results
The classification results of our XGBoost model can be seen in the following table.
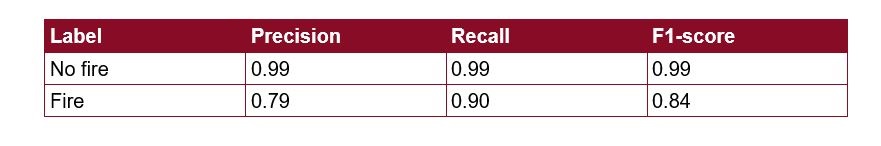
Here, the precision tells us the number of true positives among the predicted labels which means that 99% of the data points labelled “No fire” were correctly classified. Meanwhile only 79% of the instances labelled as “Fire” were actually from the database of fires (21% had not caught fire, but were wrongly classified). However, since there were a lot less data points in the fire database, this number is acceptable. Probably the most crucial part of the prediction is represented by the recall of “Fire” instances. This tells us how many fires we caught. We can see that the model misclassified 10% of fires. The F1 score summarises the precision and recall and tells us how well the model did on the data with the corresponding label.
Overall, these results gave us a lot of hope that machine learning can be used for fire risk scores and prediction. Even though we cannot predict the fire score of specific buildings from the databases used here, we can use these models to predict the number of fires in certain areas. Thanks to the explainability of the XGBoost algorithm, we were also able to find the most significant features and see which ones the model used in the prediction. The output of these models can be used together with the ones we train in the future, for instance, models that will be trained on more sensitive data, to give better predictions.
Written by Andre Ostrak
[1] Estonian Rescue Board Yearbook 2017, https://www.rescue.ee/files/2018-10/pa-aastaraamat-2017-eng.pdf
[2] Estonian Rescue Board Yearbook 2018, https://www.rescue.ee/files/2019-04/pa-aastaraamat-2018-final-eng-22042019.pdf
[3] https://www.ehr.ee/
[4] T. Chen, C. Guestrin, “XGBoost: A Scalable Tree Boosting System”, KDD '16: Proceedings of the 22nd ACM SIGKDD International Conference on Knowledge Discovery and Data Mining, doi.org/10.1145/2939672.2939785
[5] https://xgboost.readthedocs.io/en/latest/tutorials/param_tuning.html
This project is supported by the European Regional Development Fund (project no RITA/02-96).